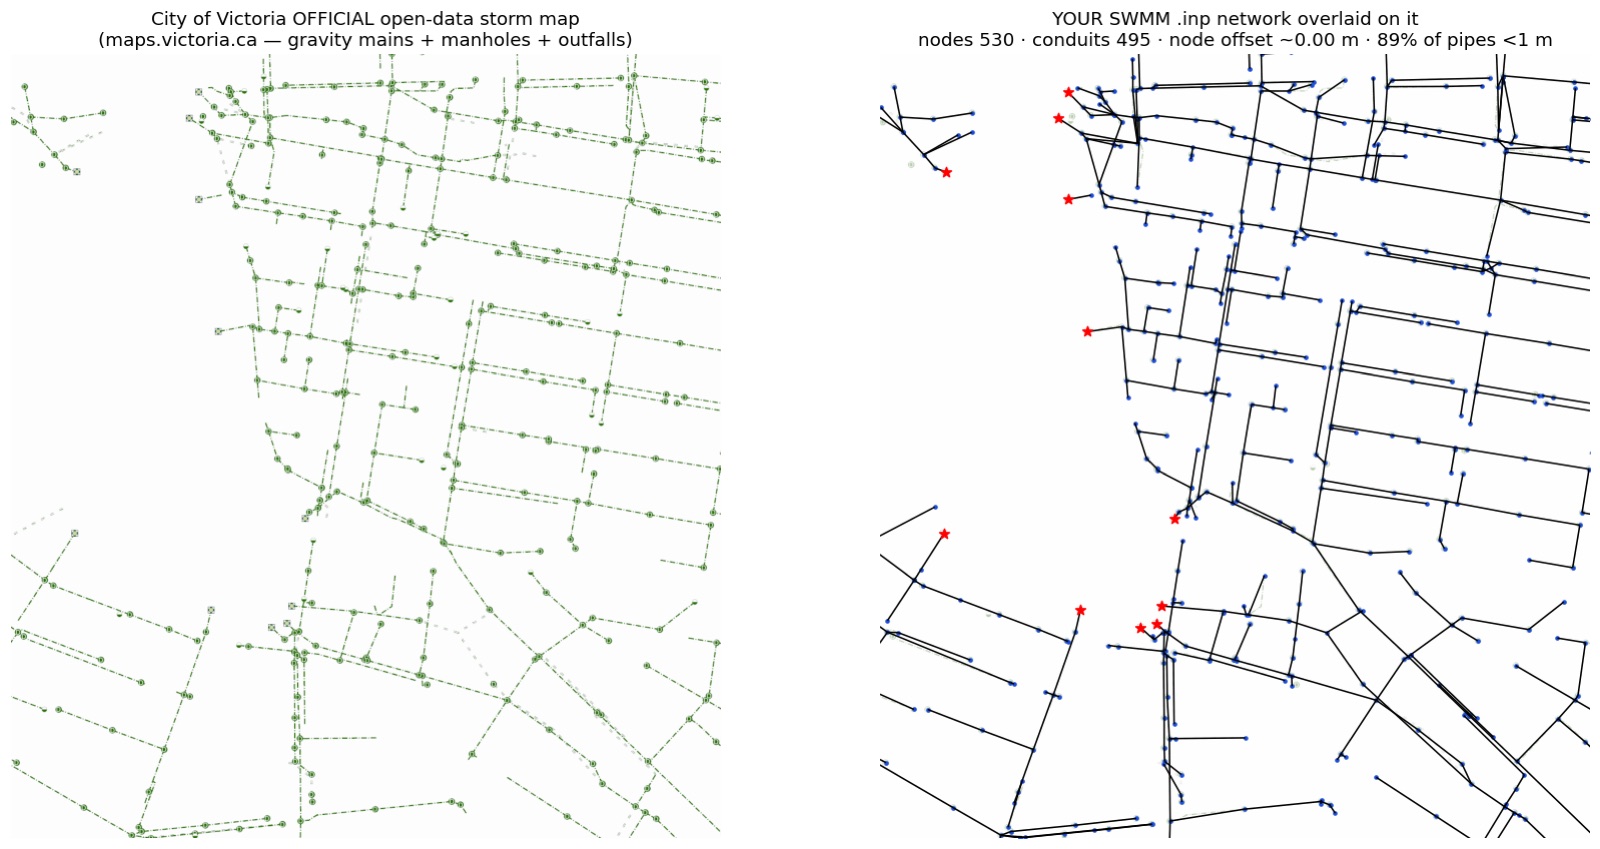
Real
Rainfall, terrain, land cover, soil, and — in the 35 real-network cities — the pipe network itself come straight from published data.
Every layer of a SWMMCanada model traces back to a public Canadian or global dataset — no licensed data, no manual downloads. Here is what goes in, and what each source provides.
| Model layer | Source | What it provides |
|---|---|---|
| Rainfall & temperature | ECCC historical climate data | Observed precipitation and temperature time series for your simulation window; temperature also enables snowmelt in the model. |
| Design storms | ECCC IDF curves | Real intensity–duration–frequency values used to size synthesized pipes with the rational method. |
| Terrain | NRCan MRDEM + HRDEM LiDAR | Elevation for subcatchment delineation and slopes — 1 m LiDAR is selected automatically wherever a sampled read proves coverage, MRDEM-30 everywhere else. It also anchors node inverts where a city publishes none. |
| Land cover | NALCMS | Imperviousness and land-use parameters for each subcatchment. |
| Soil | SoilGrids | Soil properties behind the infiltration parameters. |
| Streets | OpenStreetMap | The street graph that network synthesis follows outside the real-network cities — also burned into the DEM so urban flow follows roads. |
| Storm & sanitary networks | 35 municipal open-data portals | Real pipes, inverts, diameters, manholes, and outfalls in 34 Canadian municipalities plus Reykjavík, Iceland — with parcels and building footprints where published. |
| Streamflow | ECCC HYDAT + WSC basin polygons | Observed flows and official gauged-basin boundaries — used for the Graham Creek gauge case study and for downstream calibration. |
The full list — with links, licences, and exactly how each dataset is used — lives in DATA.md in the repository.
All 35 real-network cities use real pipes — published locations, connectivity, diameters and materials. What differs is the vertical data: how many node inverts the city actually publishes, and how many have to be estimated. That is the single number that decides whether a model is a screening tool or something you can reason about hydraulically, so it is published rather than buried.
Published inverts, ≤10% of nodes gap-filled on the recorded test area.
Published inverts with real gaps — ~10–35% filled from neighbours, manhole rims, or the DEM surface.
Vertical data thin (>35% estimated). Pipe locations are real; a large share of inverts is not. Fine for first-pass screening, not for detailed design.
"Typ. err" is measured, not asserted: the published inverts on each city's test area are masked at that city's own sparsity, the gap-fill is re-run, and the estimates are compared against the values that were hidden. The tier is shown in the app before you build, and every build reports the exact per-source counts for your area.
| City | Vertical data (inverts) | Network topology | Subcatchment outline | Imperviousness |
|---|---|---|---|---|
| Abbotsford, BC | B ~16% gap-filled · typ. err 0.7 m | geometry-inferred | real parcel lines | land cover (no buildings published) |
| Barrie, ON | B ~20% · 1.0 m | geometry-inferred | real parcel lines | real buildings |
| Burnaby, BC | B ~20% · 1.8 m | geometry-inferred | real parcel lines | real buildings |
| Calgary, AB | A typ. err 0.4 m | geometry-inferred | real parcel lines | real buildings |
| Chilliwack, BC | B ~26% · 0.3 m | geometry-inferred | catch-basin tessellation | land cover |
| Coquitlam, BC | A ~7% · 0.8 m | geometry-inferred | real parcel lines | real buildings |
| Delta, BC | B ~17% · 2.4 m | geometry-inferred | junction cells (no catch-basin layer) | land cover |
| Esquimalt, BC | B ~25% · 2.0 m | geometry-inferred | real parcel lines | real buildings |
| Greater Sudbury, ON | B ~34% · 0.9 m | geometry-inferred | real parcel lines | real buildings |
| Kamloops, BC | A ~4% · 2.1 m | geometry-inferred | catch-basin tessellation | real buildings |
| Kelowna, BC | A typ. err 0.7 m | geometry-inferred | real parcel lines | real buildings |
| Kingston, ON | C ~60% · 1.4 m | geometry-inferred | catch-basin tessellation | real buildings |
| Kitchener–Waterloo, ON | A typ. err 0.9 m | explicit node IDs | catch-basin tessellation | land cover (no parcels published) |
| Langley (Township), BC | A ~7% · 1.3 m | geometry-inferred | real parcel lines | land cover |
| London, ON | A typ. err 0.8 m | explicit node IDs | real parcel lines | real buildings |
| Moncton, NB | B ~25% · 0.7 m | geometry-inferred | real parcel lines | real buildings |
| Nanaimo, BC | C ~41% · 4.1 m | geometry-inferred | real parcel lines | real buildings |
| New Westminster, BC | C ~30% · 4.1 m | geometry-inferred | real parcel lines | real buildings |
| North Vancouver (District), BC | C ~66% · 1.7 m | geometry-inferred | junction cells (packaged download) | land cover |
| Ottawa, ON | A typ. err 1.0 m | geometry-inferred | catch-basin tessellation | land cover (no parcels published) |
| Penticton, BC | B ~13% · 0.8 m | geometry-inferred | catch-basin tessellation | land cover |
| Peterborough, ON | B ~17% · 0.5 m | geometry-inferred | catch-basin tessellation | land cover |
| Port Coquitlam, BC | B ~28% · 0.4 m | geometry-inferred | real parcel lines | real buildings |
| Regina, SK | A typ. err 0.6 m | geometry-inferred | real parcel lines | real buildings |
| Reykjavík, IS | C error not measured (synthetic fixture) | geometry-inferred | real parcel lines | real buildings |
| Sarnia, ON | A ~10% · 0.5 m | geometry-inferred | catch-basin tessellation | real buildings |
| Saskatoon, SK | A ~9% · 1.2 m | geometry-inferred | real parcel lines | land cover |
| Strathcona County, AB | C ~48% · 1.6 m | geometry-inferred | catch-basin tessellation | real buildings |
| Surrey, BC | A typ. err 0.7 m | geometry-inferred | real parcel lines | real buildings |
| Toronto, ON | B ~15% · 0.8 m | geometry-inferred | catch-basin tessellation | land cover |
| Vancouver, BC | B typ. err 1.3 m | geometry-inferred | real parcel lines | real buildings |
| Victoria, BC | A typ. err 1.3 m | explicit node IDs | real parcel lines | real buildings |
| Whitby, ON | C ~70% · 0.7 m | geometry-inferred | catch-basin tessellation | land cover |
| White Rock, BC | C ~36% · 3.3 m | geometry-inferred | real parcel lines | real buildings |
| Windsor, ON | B ~21% · 0.9 m | geometry-inferred | junction cells (packaged download) | land cover |
Percentages are measured on each city's recorded test area. "Geometry-inferred" topology means nodes come from snapped pipe endpoints — most of those cities still publish manhole IDs, which are kept as node names. Outside these cities the network itself is synthesized from OpenStreetMap streets.
Two cities worth reading the footnotes on: New Westminster sits in tier C despite a ~30% gap-fill share, because only about a quarter of its "published" pipe-end inverts are true pipe measurements (the rest are manhole chamber stamps) and estimates on its steep riverfront err ~4 m. Reykjavík sits outside the Canadian DEM, so the terrain tier cannot help its gaps at all.
Rainfall, terrain, land cover, soil, and — in the 35 real-network cities — the pipe network itself come straight from published data.
Subcatchment boundaries, slopes, imperviousness, and infiltration parameters are computed from those datasets with documented methods.
Rainfall losses, roughness, and curve numbers are first-pass estimates. Every approximation is called out in ASSUMPTIONS.md, layer by layer.
Data quality claims are only worth what they can be checked against. Node positions are compared field by field with the cities' own maps, the models are run in the EPA SWMM 5.2 engine, and one full basin is compared against an independent Water Survey of Canada flow gauge.