Why this project exists

Building an urban drainage model normally starts with days of data hunting: rainfall from one portal, terrain from another, land cover, soil, design-storm intensities, and — if you're lucky — the city's pipe network in yet another format. Then everything has to be clipped, reprojected, parameterized, and assembled by hand before the first simulation can run.

SWMMCanada collapses all of that into one step. You draw a boundary; it pulls the open data for that spot and assembles a complete, validated model.inp.

The goal is a complete, runnable first-pass model in minutes — grounded in real data, honest about its approximations, and ready for calibration downstream.

Two modes, picked automatically

SWMMCanada chooses from where you draw

01

Real network — 35 cities

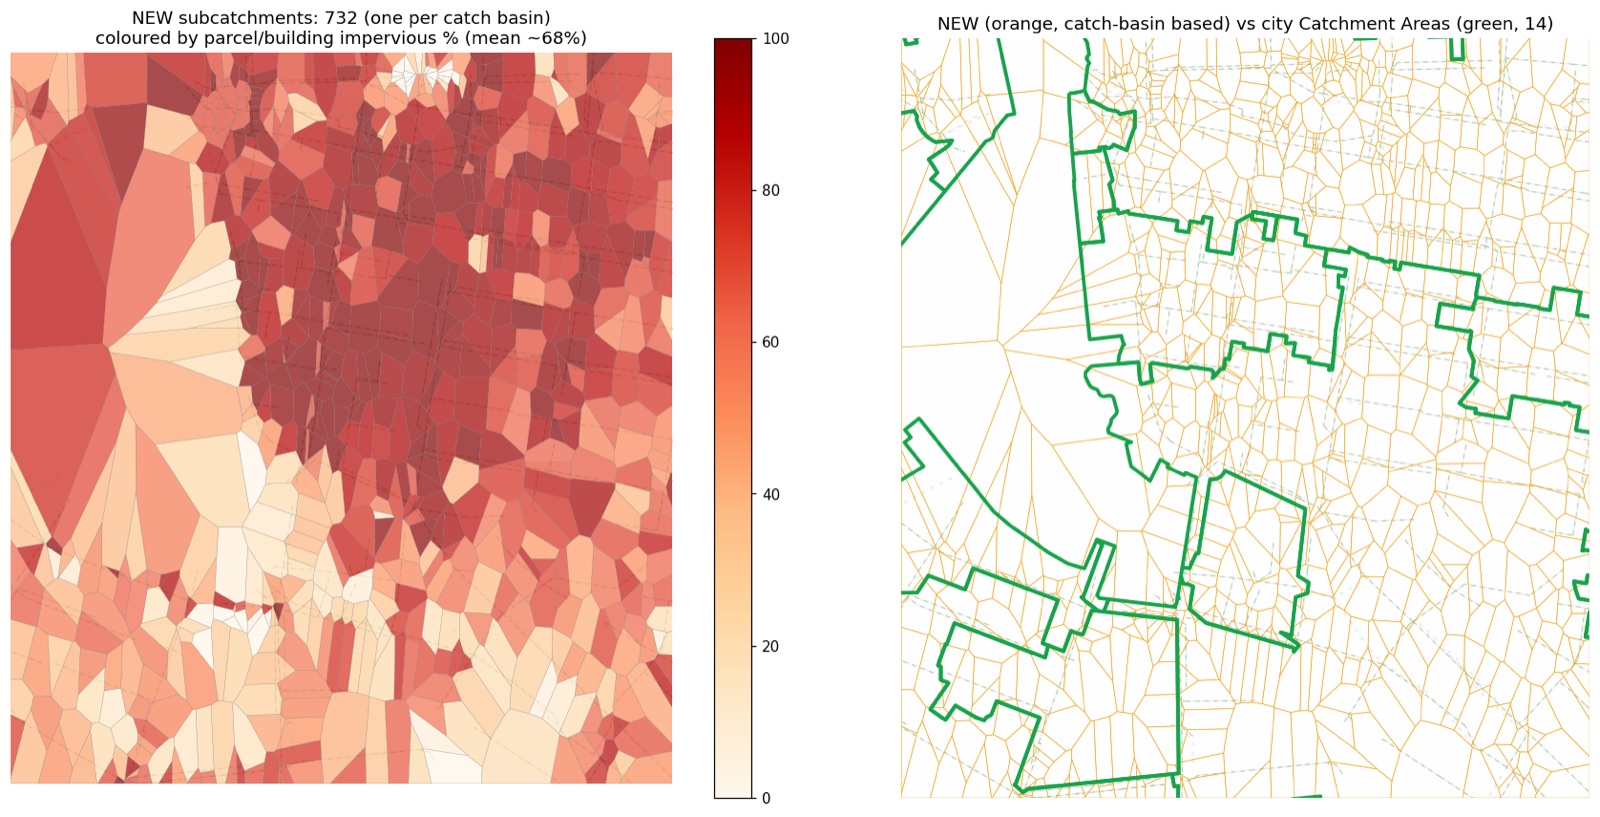
In 34 Canadian municipalities and Reykjavík, Iceland, the model uses the city's published storm pipes: real inverts, diameters, manholes, and outfalls. Where parcels are published, subcatchments follow real lot lines; where building footprints are published, imperviousness comes from real roofs and road right-of-way rather than a 30 m raster.

02

Synthesize — anywhere else

Everywhere else in Canada, a realistic network is built from the street map and open data: DEM-delineated subcatchments where the terrain earns it (with a Voronoi fallback), and pipes sized by the rational method with real ECCC IDF intensities.

03

Storm and wastewater

Where a city publishes its sanitary sewer, the model carries it as a second tagged system in the same .inp — with pipes, manholes and water: service areas carry a population estimate and place a dry-weather flow with a diurnal pattern on the node they serve. The foundation for dual-drainage and separated-sewer studies.

Coverage

35 cities publish a network SWMMCanada can read

Each city's open-data schema is different, so every one is a small adapter — a fetch plus a field mapping — over one shared assembler. Draw inside any of them and the real pipes are used automatically; draw anywhere else in Canada and the network is synthesized instead. No setting to choose.

Region Cities
British Columbia (18) Victoria · Vancouver · Surrey · Burnaby · Coquitlam · Port Coquitlam · New Westminster · North Vancouver (District) · Delta · Township of Langley · White Rock · Chilliwack · Abbotsford · Nanaimo · Kamloops · Kelowna · Penticton · Esquimalt
Ontario (11) Ottawa · Toronto · London · Kitchener–Waterloo · Kingston · Peterborough · Barrie · Sarnia · Windsor · Whitby · Greater Sudbury
Alberta (2) Calgary · Strathcona County
Saskatchewan (2) Regina · Saskatoon
New Brunswick (1) Moncton
International (1) Reykjavík, Iceland — on the national fitjuskrá schema, proving the assembler is not Canada-specific

Cities differ in how complete their vertical data is, and SWMMCanada says so out loud: every city carries a published data tier (A, B or C) with a measured typical invert error, shown in the app before you build. See the per-city tiers →

What you get

Every build ships one result package

The datastore is the hub, not a by-product: the SWMM file is one view of the model. Every export target reads from the same neutral store, so you can regenerate the model for another engine — or with different options — without refetching a single dataset.

01

model.inp

Runs in EPA SWMM 5.2, with snowmelt whenever temperature data exists, plus a manifest.json recording exactly what went in.

02

Shareable datastore

The model itself: a GeoPackage network, netCDF/CF forcing (rain, temperature, evaporation), and JSON provenance recording where every value came from.

03

MIKE+ import package

A DHI MIKE+ Collection System package: nodes / links / catchments shapefiles, rainfall CSV, and a field-mapping sheet with every approximation documented inside.

04

InfoWorks ICM package

An Open Data Import Centre package with CSVs named for ODIC Auto-Map, subcatchment shapefiles, and an InfoWorks-format rainfall event — the SWMM curve number transfers losslessly.

05

validation.json

The model's health report: structural checks, the delineation method actually used and why, and how much of the vertical data was estimated rather than published.

06

Map preview layers

Preview layers for the web UI, so you can inspect the network, outfalls, and subcatchments before downloading anything.

Fidelity

Subcatchments that follow real lot lines

Rain reaching an inlet and sewage reaching a manhole are different phenomena with different boundaries, so SWMMCanada models them as different things: surface catchments are shaped by terrain, streets and inlets; wastewater service areas are shaped by parcels and laterals and may legitimately cross a topographic divide.

Parcel-shaped subcatchments in downtown Victoria, following real lot lines

Honest by design

SWMMCanada gets you a complete, runnable model fast — but the parameters (rainfall losses, roughness, curve numbers) are first-pass estimates. Models are not calibrated, and the project says so everywhere it matters: the assumptions document walks through what's real, derived, or approximated, layer by layer, and every export package documents its approximations inside.

Calibrate against observations before using any results for design or decisions — which is exactly what Agentic SWMM automates downstream.