Draw
Draw (or upload) a boundary anywhere in Canada in the web app, pick your simulation dates, and click Build SWMM model.
Draw a boundary on the map and get a complete, ready-to-run EPA SWMM stormwater model — rainfall, terrain, land cover, soil, and the city's real storm and sanitary pipes, assembled from open data. No hunting across data portals, no manual setup.

› draw a boundary on the map
  · ECCC rainfall + design storms
  · 1 m LiDAR terrain where available
  · land cover · soil · storm + sanitary pipes
✓ model.inp ready · runs in EPA SWMM 5.2
✓ exports · MIKE+ · InfoWorks ICM
Draw (or upload) a boundary anywhere in Canada in the web app, pick your simulation dates, and click Build SWMM model.
SWMMCanada pulls the Canadian open data for that spot — rainfall, terrain (1 m LiDAR where available), land cover, soil, ECCC design-storm intensities, and the city's storm and sanitary pipes.
A complete, validated model.inp you can open and run in EPA SWMM 5.2 — plus a shareable datastore and export packages for MIKE+ and InfoWorks ICM.
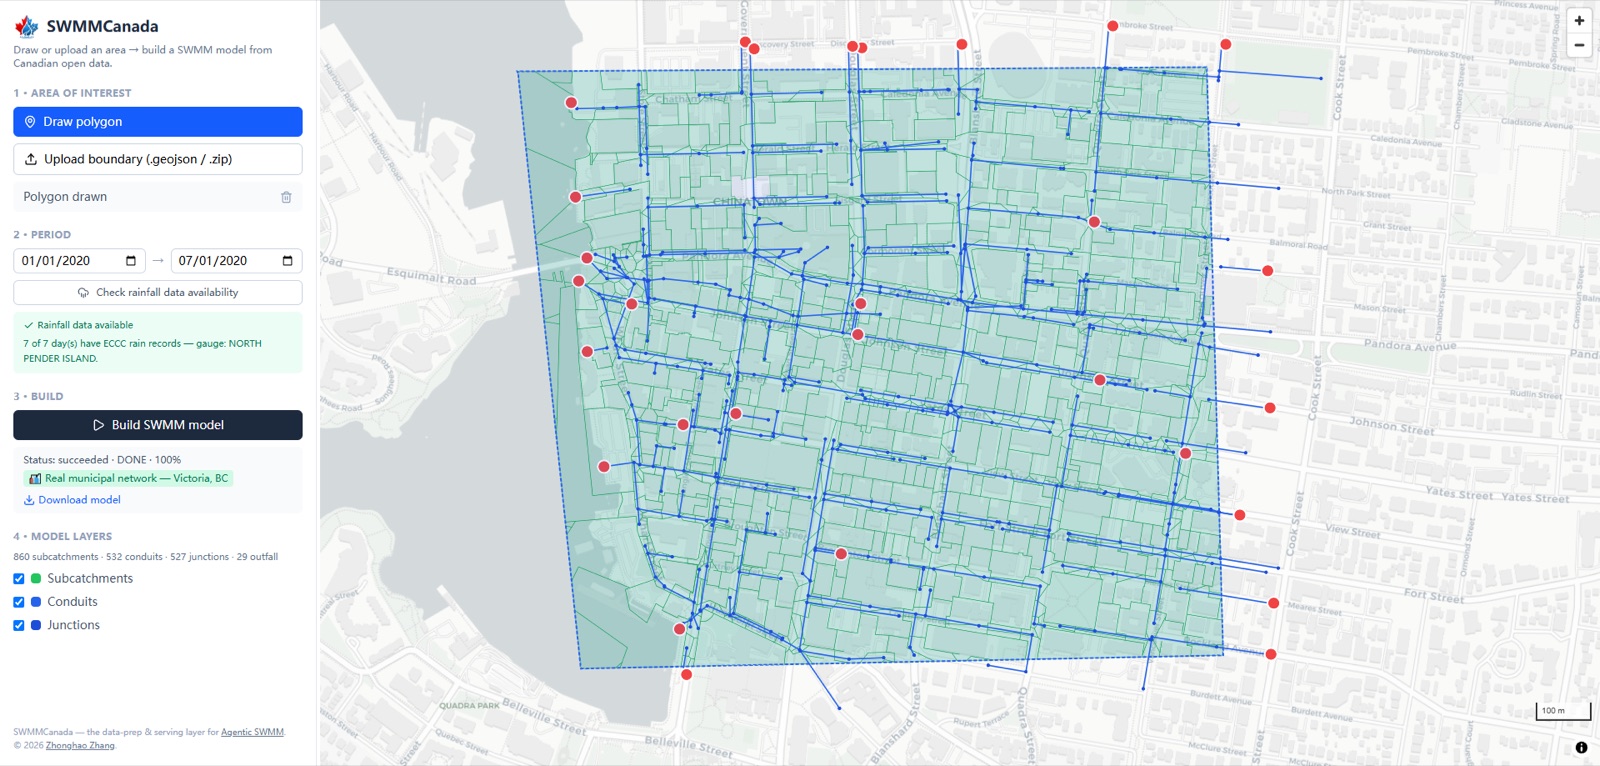
Downtown Victoria after a build: the storm network (blue) and the sanitary network (brick) with flow arrows and diameter-scaled pipes, per-system layer toggles, and click-to-inspect attributes — with the model package (SWMM, MIKE+, ICM) ready to download.
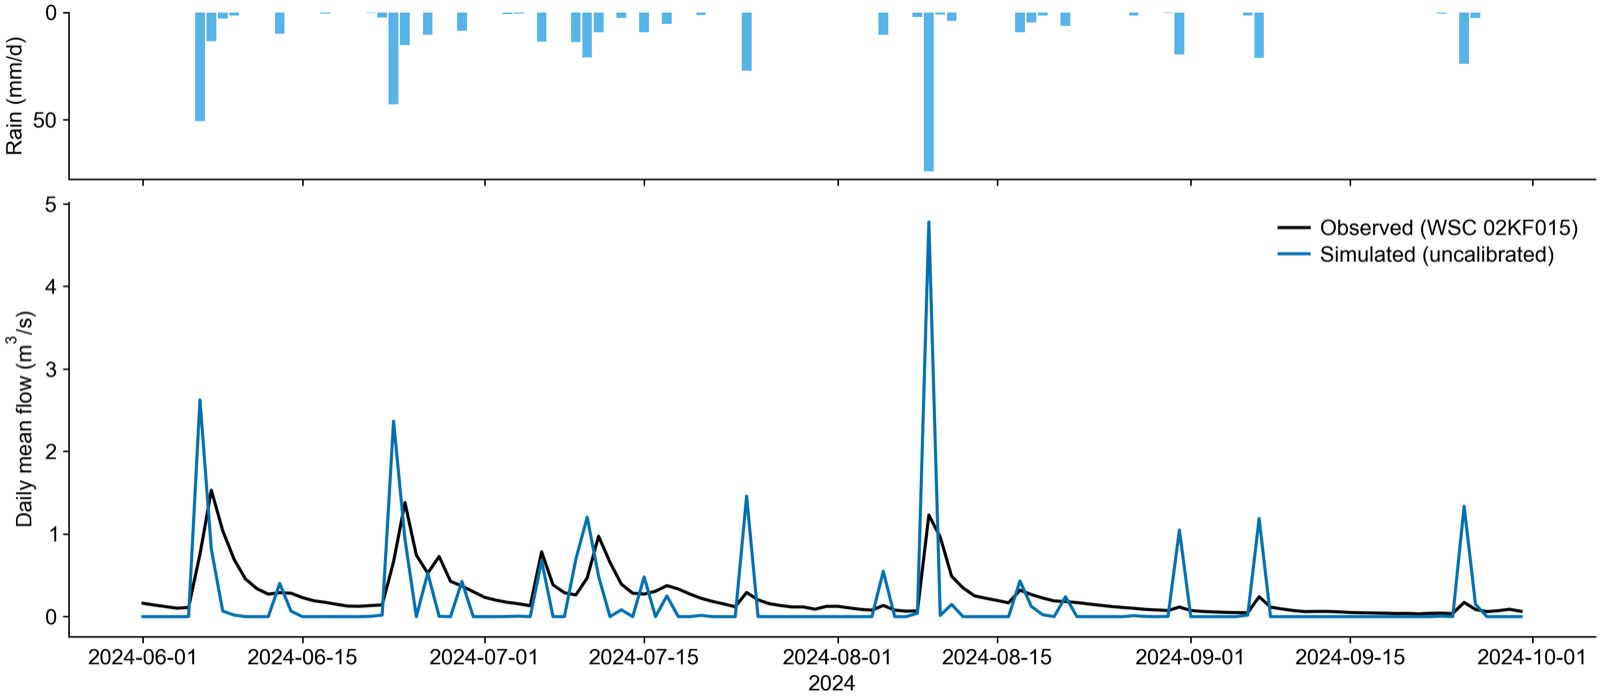
Automatic model building is easy to claim and hard to prove. Over the summer of 2024, an uncalibrated model built automatically over the official 22 km² Water Survey of Canada basin for Graham Creek, Ottawa reproduced all 12 rainfall events on the correct days against the measured record, with a total volume bias of −22.3%. The remaining gaps are structural and explained rather than tuned away.
Uses the city's published storm pipes — real inverts, diameters, manholes, and outfalls — in 34 Canadian municipalities from Victoria to Moncton, plus Reykjavík, Iceland, the first international city. Where a city publishes parcels, subcatchments follow real lot lines; where it publishes a sanitary sewer, the model carries it as a second tagged system with its own dry-weather flow.
Builds a realistic network from the street map and open data — DEM-delineated subcatchments where the terrain earns it, and pipes sized by the rational method with real ECCC IDF design-storm intensities.
SWMMCanada turns an area into a complete, runnable model. The second half, Agentic SWMM, takes that model the rest of the way — it runs EPA SWMM, calibrates against observations, post-processes, and quantifies uncertainty.
Hand a SWMMCanada package to Agentic SWMM and the loop closes: open data → model → calibrated results with uncertainty. It does the downstream work through plain natural-language chat, and every step stays auditable and transparent.
Open Agentic SWMM on GitHub →The two build modes, the pipeline, and everything a build ships — datastore, exports, and validation.
Every open dataset behind a model, and how complete each city's data really is — tier A, B, or C.
The gauge case study, EPA SWMM engine validation, and fidelity against the cities' own published maps.
The hosted beta, the prebuilt Docker image, running from source, and self-hosting.
The full pipeline on GitHub — 35 city adapters, the assembler, the exporters, and every document behind them. MIT licensed.